Behind the scenes — building the stats dashboard
The thinking behind DetectID's six-tile stats strip on the collection page — what made the cut, what didn't, and what's coming next.
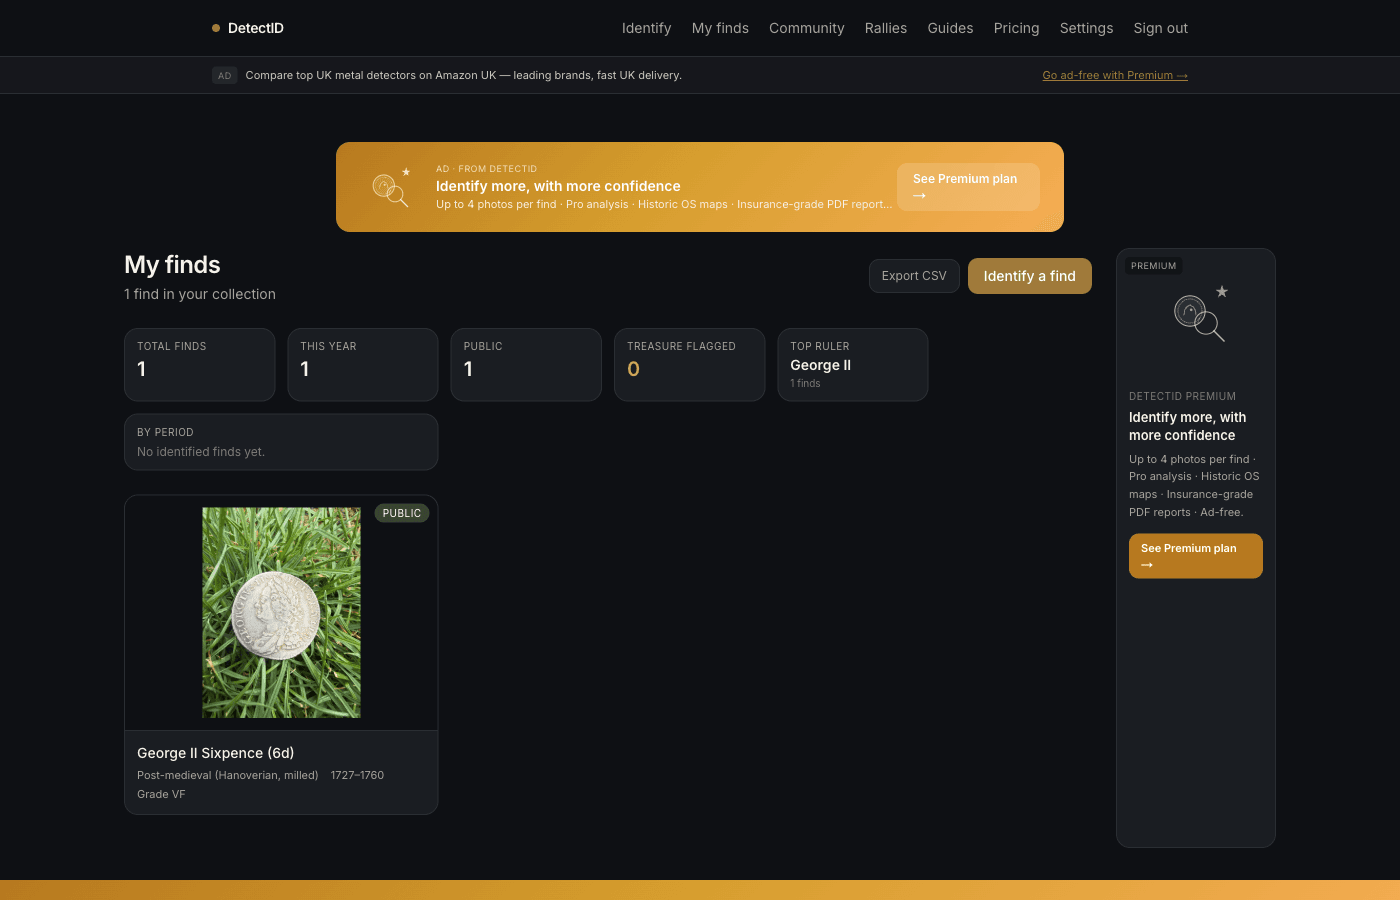
We recently added a six-tile stats strip to the top of every user’s /findspage. This is a short behind-the-scenes on why those six tiles, what we left out, and what we’re likely to add next. Part documentation, part design walkthrough.
What the strip shows today
Six tiles, in this order:
- Total finds. Everything in your collection.
- This year. Finds with a created-at inside the current calendar year.
- Public. Finds you’ve marked public.
- Treasure flagged. Finds the engine flagged as potentially Treasure-Act-eligible.
- Top ruler. The ruler appearing most across your identified finds.
- By period. Roman / Anglo-Saxon / Medieval / Post-medieval / Modern counts.
Aggregated from your full collection on every page load — not just the visible 60 in the grid below.
The design constraints we set
Three rules going in:
- Glance-able. The stats should be readable in under three seconds. No charts, no time-series, no interaction needed.
- Every tile earns its place.A tile that merely “adds information” without telling the user something they’d act on becomes wallpaper. Six was the ceiling.
- Same for everyone.No personalised tiles based on detection patterns — we’re not running an engagement engine. The stats are factual readouts of your collection.
What we deliberately left out

Per-session breakdowns
We considered adding a tile for “Best session this year” or “Top permission”. Both are useful but they need more screen real estate than a glance tile allows. They’re coming as a separate insights view in a later release.
Material breakdowns
Silver / bronze / gold / copper-alloy counts would be possible but they’d duplicate what the “By period” tile already captures (period correlates strongly with material in UK detecting).
Find spot density
We thought about “Hot field” — the permission that produced most finds. Decided against because it encourages a fixation on a single spot at the expense of wider exploration, and because permission labels are per-session not per-find.
Valuations
DetectID doesn’t value finds. There’s no “Total collection worth” tile because we’d be making things up. If valuations are something you want, the CSV export lets you add your own.
Streaks and gamification
“Days in a row with a new find”, “Longest weekly streak”, “Find a new ruler this month”. All easy to build, all gamification mechanics we deliberately rejected. We don’t want detectorists feeling pressured to upload finds to maintain a streak — that distorts behaviour away from the hobby’s rhythm.
How the numbers are computed
Mostly straightforward Postgres aggregations:
- Total finds. COUNT of finds where user_id is yours and is_archived is false.
- This year. Same COUNT with a filter on created_at ≥ 1 January.
- Public. Same COUNT with is_public = true.
- Treasure flagged. COUNT of identifications where treasure_act_flag is true.
- Top ruler. SELECT ruler, COUNT(*) GROUP BY ruler ORDER BY count DESC LIMIT 1, ignoring nulls.
- By period. SELECT period, COUNT(*) GROUP BY period, returning a small fixed set.
All six queries fire in parallel; total latency on a typical collection is around 80 ms. We don’t cache the stats — they’re cheap enough to recompute on every load, and that means they’re always accurate.
What’s next for stats
On the roadmap:
- Per-session view.Detecting-sessions get their own stats panel on the map page — total finds this session, by period.
- Per-permission view. When the permission tracker ships (see roadmap), each tracked permission gets its own productivity counters.
- Year-end summary.A static page that recaps the year — once, in January, for the year gone. Not a weekly “your year so far” nag, just a clean retrospective.
- By-county map view. See your finds by county as a list with counts. Already on the map view spatially; this would be the textual version.
Why expose the design thinking?
Two reasons:
- Trust.If you can see why we built it this way and what we’d change, you’re more likely to believe the next thing we ship is also thought-through.
- Feedback loop.Posting the constraints out loud gives detectorists ammunition to push back. The “swap Treasure-flagged for Best graded” note above came from feedback after the strip went live.
The CSV is the deep cut
The six-tile strip is for at-a-glance. If you want to slice your collection by anything beyond those six axes, the CSV export at the top of /finds gives you every column — ruler, denomination, period, date range, grade, diameter, weight, material, region, location, precision, detector brand and model, public flag, shared-at, notes, ID. Pull it into a spreadsheet and pivot to your heart’s content.
Full walkthrough at Reading your collection stats and exporting to CSV.
Common questions
Why no charts?
A chart on a stats strip is usually a chart that summarises already-summary data. If you want time-series of your finds, you want a different page — that’s the year-end summary above. The strip is a counter, not a chart.
Do the stats include rally finds?
Yes. Every find in your collection counts toward the stats, regardless of how it was uploaded (solo, rally, club night).
What if I archive a find?
Archived finds don’t count toward stats. They’re still in your collection but treated as removed for counter purposes.
When do the by-period buckets refresh?
Every page load. There’s no caching — the numbers are always current.
Next steps
- Reading the strip in practice: Collection stats and CSV export.
- What sessions are: Detecting sessions walkthrough.
- The wider roadmap: What we’re building next.
Try DetectID on a real find
Upload a photo and we’ll return a calibrated shortlist with period, denomination, ruler and full reasoning chain.
Identify a find