Reading your collection stats and exporting to CSV
Walkthrough of the six-tile stats strip on your /finds page, plus the CSV export — column by column — and useful spreadsheet workflows.
Your collection is more than a stack of identifications — it’s a record of what you’ve found, where, when, and with which detector. The stats strip on /findsgives you a live read on it, and the CSV export drops the whole lot into a spreadsheet for further analysis.
Where to find the stats
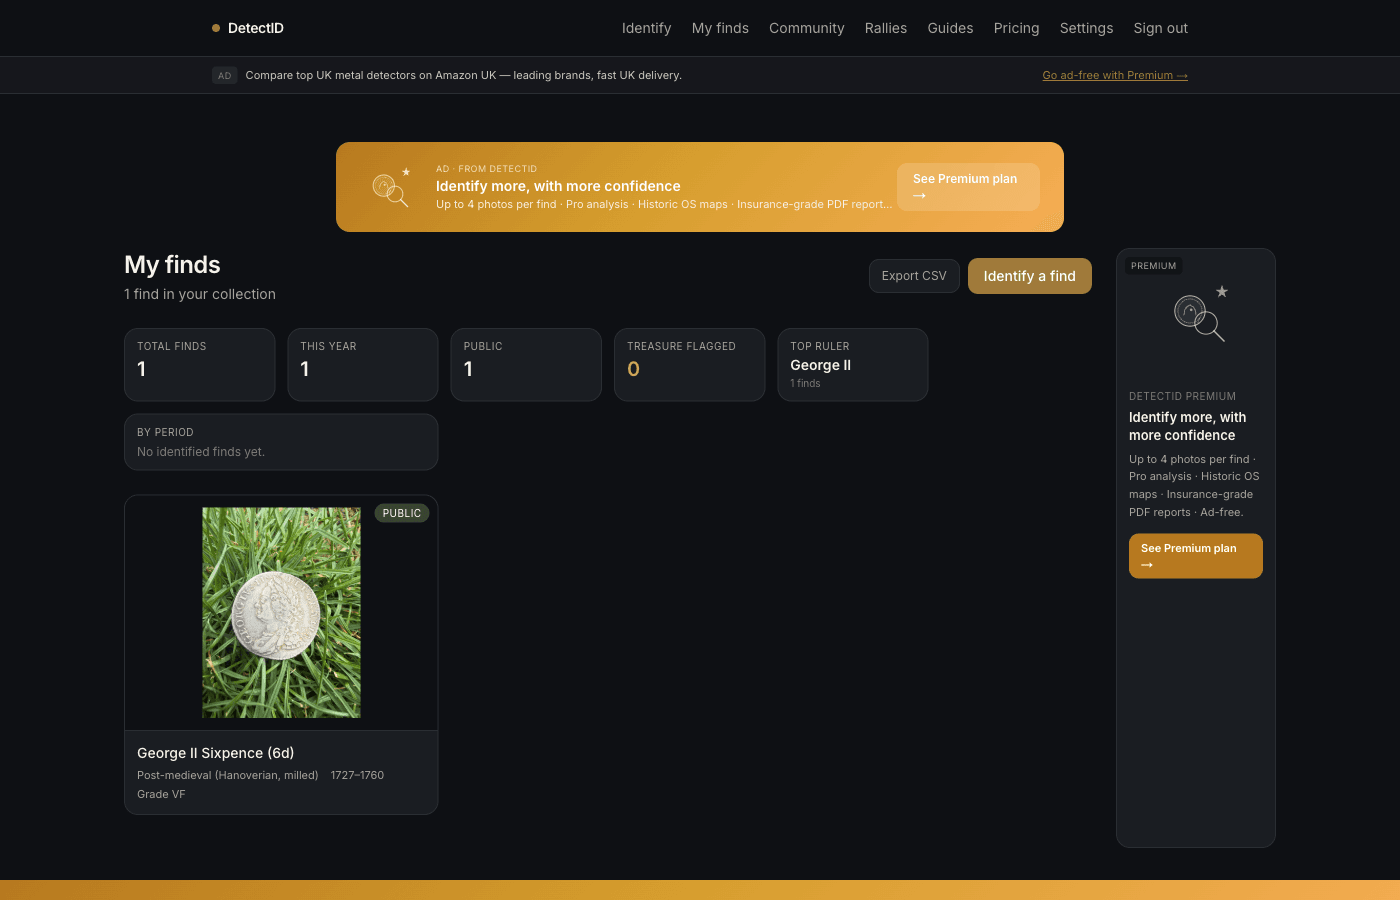
Sign in and go to app.detectid.co.uk/finds. The six-tile stats strip sits just under the page title, above the collection grid. It only appears if you have at least one find logged.
What each tile means
Total finds
Every find in your collection, including archived ones aren’t counted. Detecting sessions don’t affect this — it’s the simple total.
This year
Finds with a created-at date inside the current calendar year. Resets on 1 January. A useful at-a-glance counter for how productive your year has been.
Public
Finds you’ve toggled public — the ones appearing in the discovery feed and on your public profile. SeeSharing finds publiclyfor the full mechanics.
Treasure flagged
Finds where the engine flagged a possible Treasure Act match. A live counter helps you keep track of how many of your finds have been suggested as potentially reportable — useful for keeping in touch with your Finds Liaison Officer.
Top ruler
The ruler with the most identified finds in your collection. Worn finds where the ruler couldn’t be determined are excluded from this count. Will commonly say “Victoria” or “George III” for general detectorists, “Edward I” or “Henry III” for medievalists, “Constantine I” for Roman specialists.
By period
A horizontal strip showing your find counts across the standard UK periods: Roman, Early Medieval (Anglo-Saxon and Viking-age), Medieval, Post-medieval, Modern. Quick visual sense of the shape of your collection. A Roman bias, a hammered-silver hot streak, a quiet year — all visible at a glance.
Why we picked these six
We deliberately kept the strip to six tiles. We could have shown a dozen — total photo count, average grade, last upload date, first find date, county breakdown, materials — and rejected most. The principle: every tile should be one you’d actually glance at. More tiles than that and the strip becomes wallpaper.
If you want deeper analytics, that’s what the CSV export is for. A six-tile glance for daily use, a full spreadsheet for when you want to slice it differently.
The CSV export
The Export CSVbutton sits next to the “Identify a find” button at the top right of /finds. One click and you get a UTF-8 CSV (with byte-order mark, so Excel opens pound signs cleanly) of every find in your collection.
What columns you get
- Found / logged — the upload timestamp.
- Ruler — the engine’s top-candidate ruler.
- Denomination — penny, half-groat, sixpence, etc.
- Period — Roman, Medieval, Post-medieval, etc.
- Date range — the year span of the type, e.g. 1279–1307.
- Grade — predicted grade (P–UNC).
- Diameter (mm) — from your input or the engine’s estimate.
- Weight (g) — your input (engine doesn’t estimate weight).
- Material — silver, bronze, etc.
- Region — the county you tagged.
- Lat, Lng — coordinates if you placed a pin (at the precision you chose).
- Precision — exact, 1km, 10km, county, hidden.
- Detector brand + model — if you tagged them.
- Public — TRUE / FALSE.
- Shared at — if public, when you shared.
- Notes — whatever you wrote at upload.
- Find ID — the UUID, useful for cross-referencing.
Opening the CSV
- Excel.Double-click the file. With the UTF-8 BOM we include, pound signs (£), é, and other extended characters render correctly. No import wizard needed.
- Apple Numbers.Same — double-click and go.
- Google Sheets.File → Import → Upload. Select “Replace spreadsheet”, separator type “Detect automatically”.
- Anything else.The file is standards-compliant RFC 4180 CSV with double-quote escaping. It opens cleanly in everything we’ve tested.
Useful spreadsheet workflows
Per-permission productivity
Sort by detecting session label (coming as a CSV column soon) or by region, then pivot count by month. Spot which permissions are paying off and which are quieter.
Custom valuations
DetectID doesn’t value finds. If you want to attach your own valuations, add a column in the spreadsheet (e.g. “My valuation (£)”), sort by ruler or denomination, and use VLOOKUP / SUMIF to total by category.
Annual records
Filter rows where Found / logged is between 1 January and 31 December of a given year, then sort by grade descending. Your top finds of the year, ready to share at the club AGM.
Sync with another tool
Some detectorists keep records in iAuctionLog or a custom Notion database. The CSV import lines up cleanly — pipe it through a one-time mapping script and you’re done.
What’s coming next
On the roadmap (see What we’re building next): per-session breakdowns in the stats strip, a value-tracking column for those who want it, and a brand-leaderboard view that uses the detector tags collected through the upload form.
Next steps
- If you don’t have many finds in your collection yet: How to identify your first find.
- For making finds public: Sharing finds publicly.
- For tagging finds with detectors: see the next sections of the upload form, covered in identify your first find.
Try DetectID on a real find
Upload a photo and we’ll return a calibrated shortlist with period, denomination, ruler and full reasoning chain.
Identify a find